Optimize snapshot usage using the Trends dashboard
Three things drive your bill: how many builds you run, how many snapshots each build takes, and how many of those snapshots you’re billed for. The Trends dashboard charts all three over time. Use it to investigate usage spikes.
Getting started
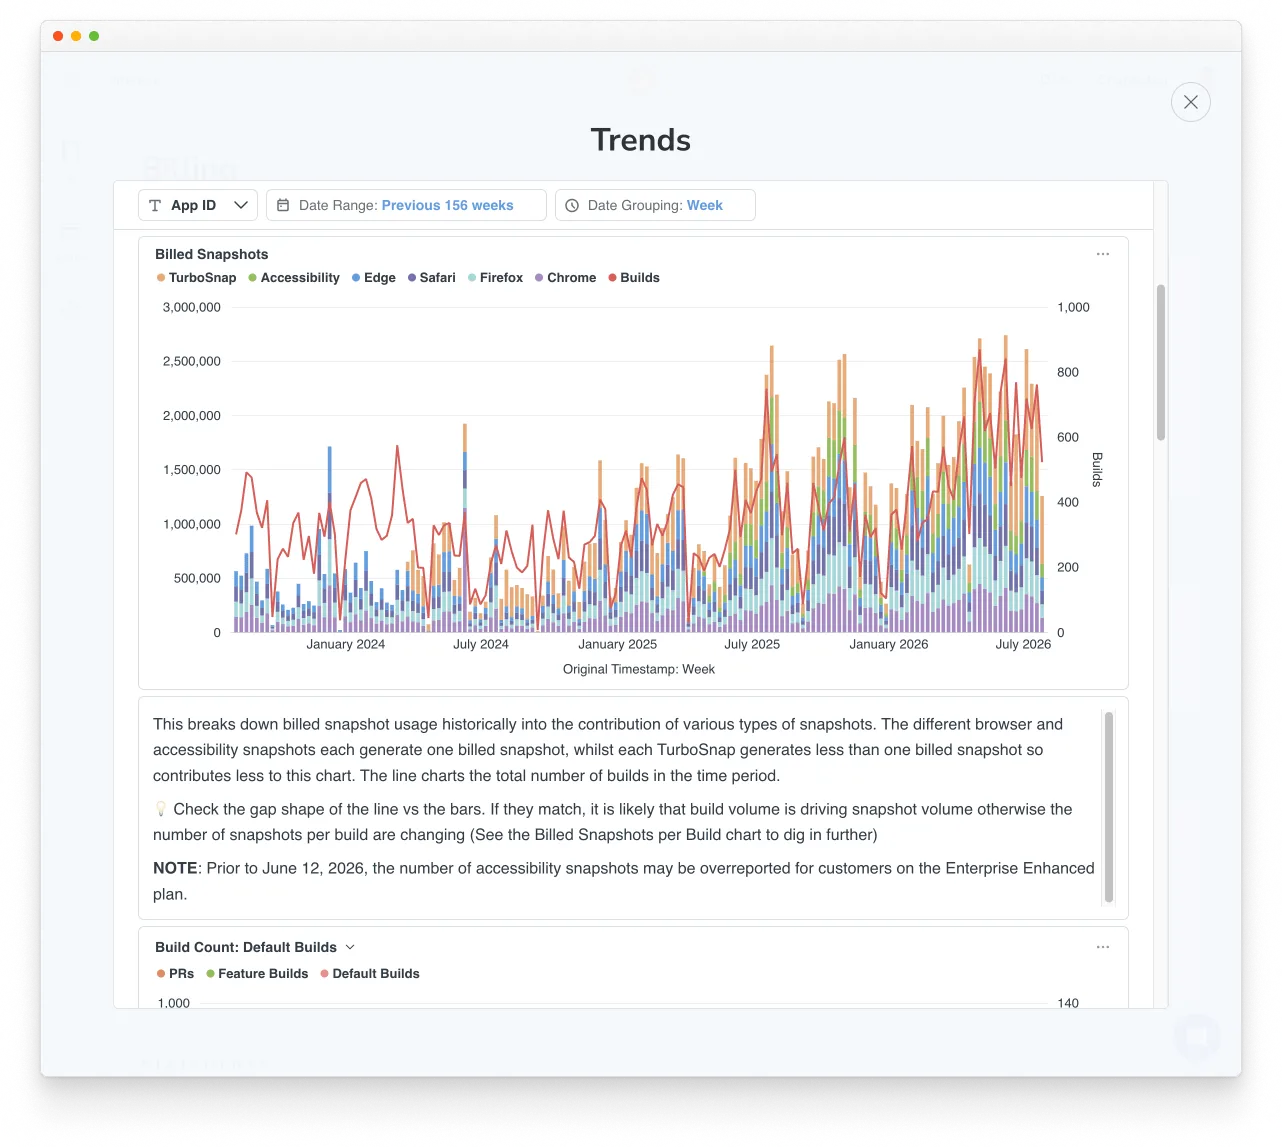
Go to the billing page and click Trends (beta). Then work through the questions below in order. Each one tests a driver and points to what to change.
When did the usage spike start, and in which project?
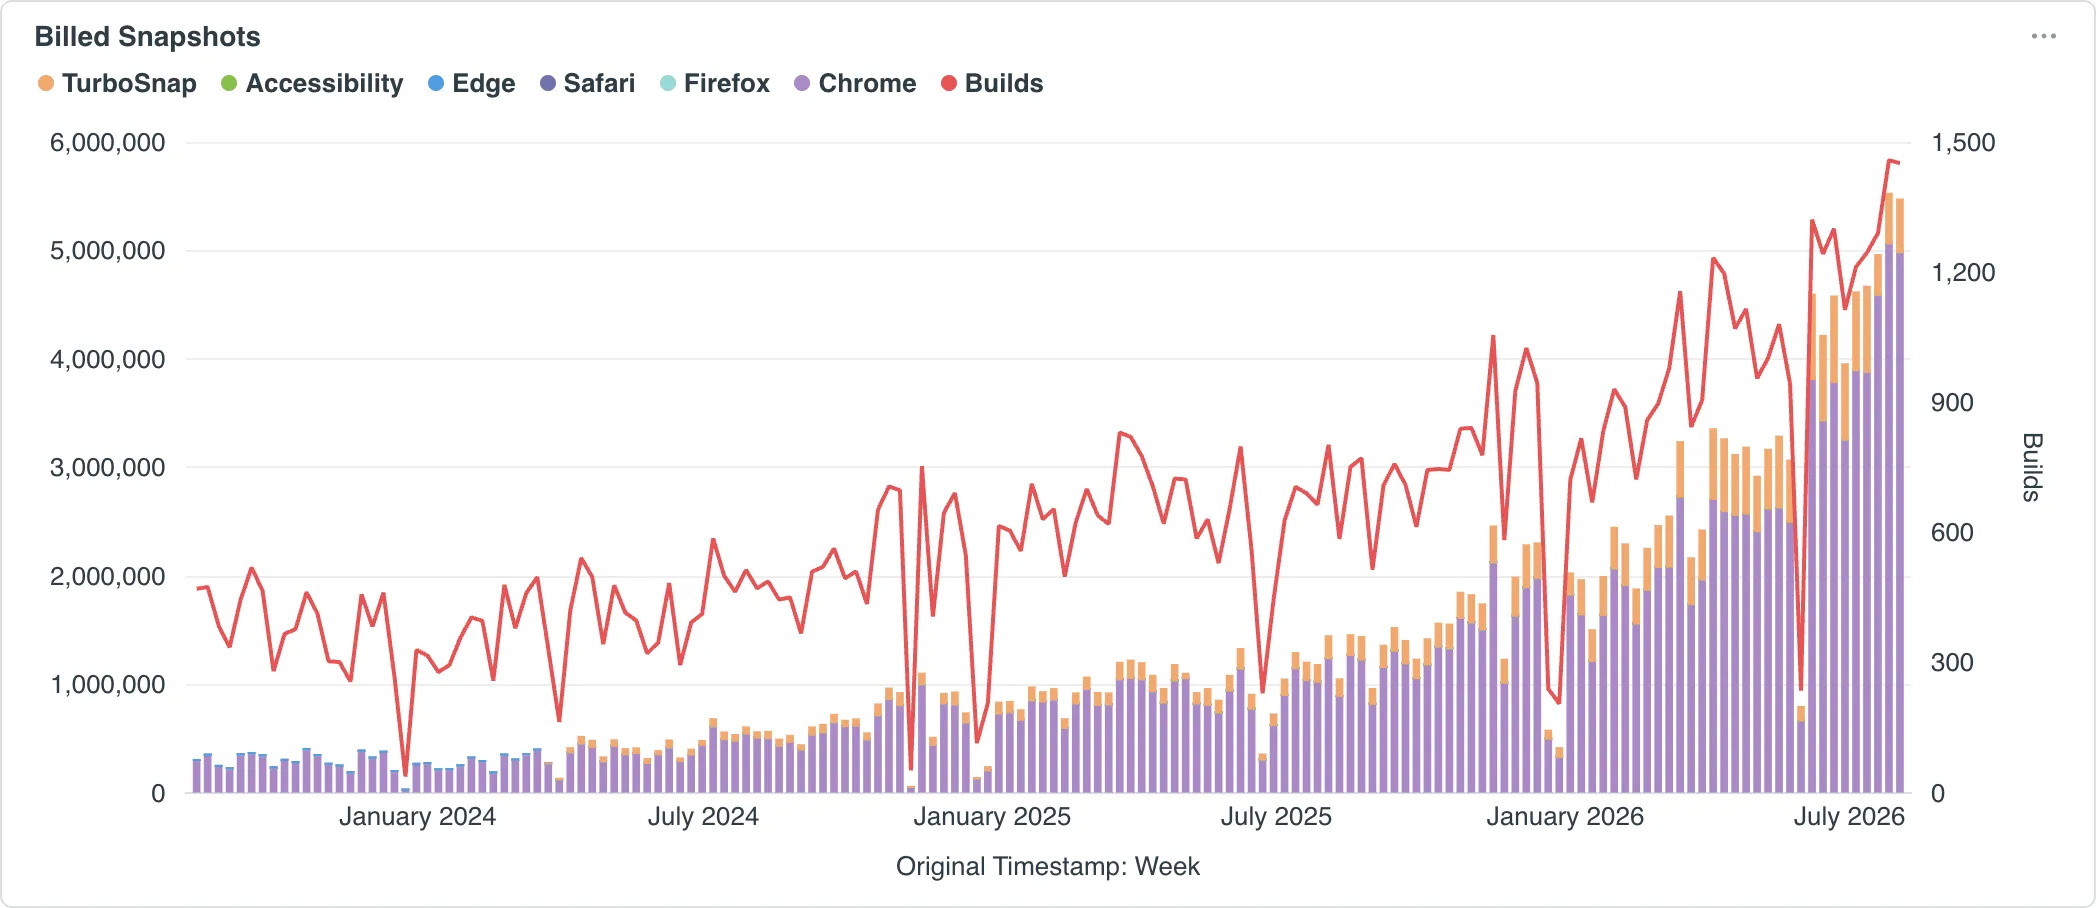
Start with the Billed Snapshots and Billed Snapshots per Project charts. You’re looking for the week usage changed and, ideally, the single project it changed in.
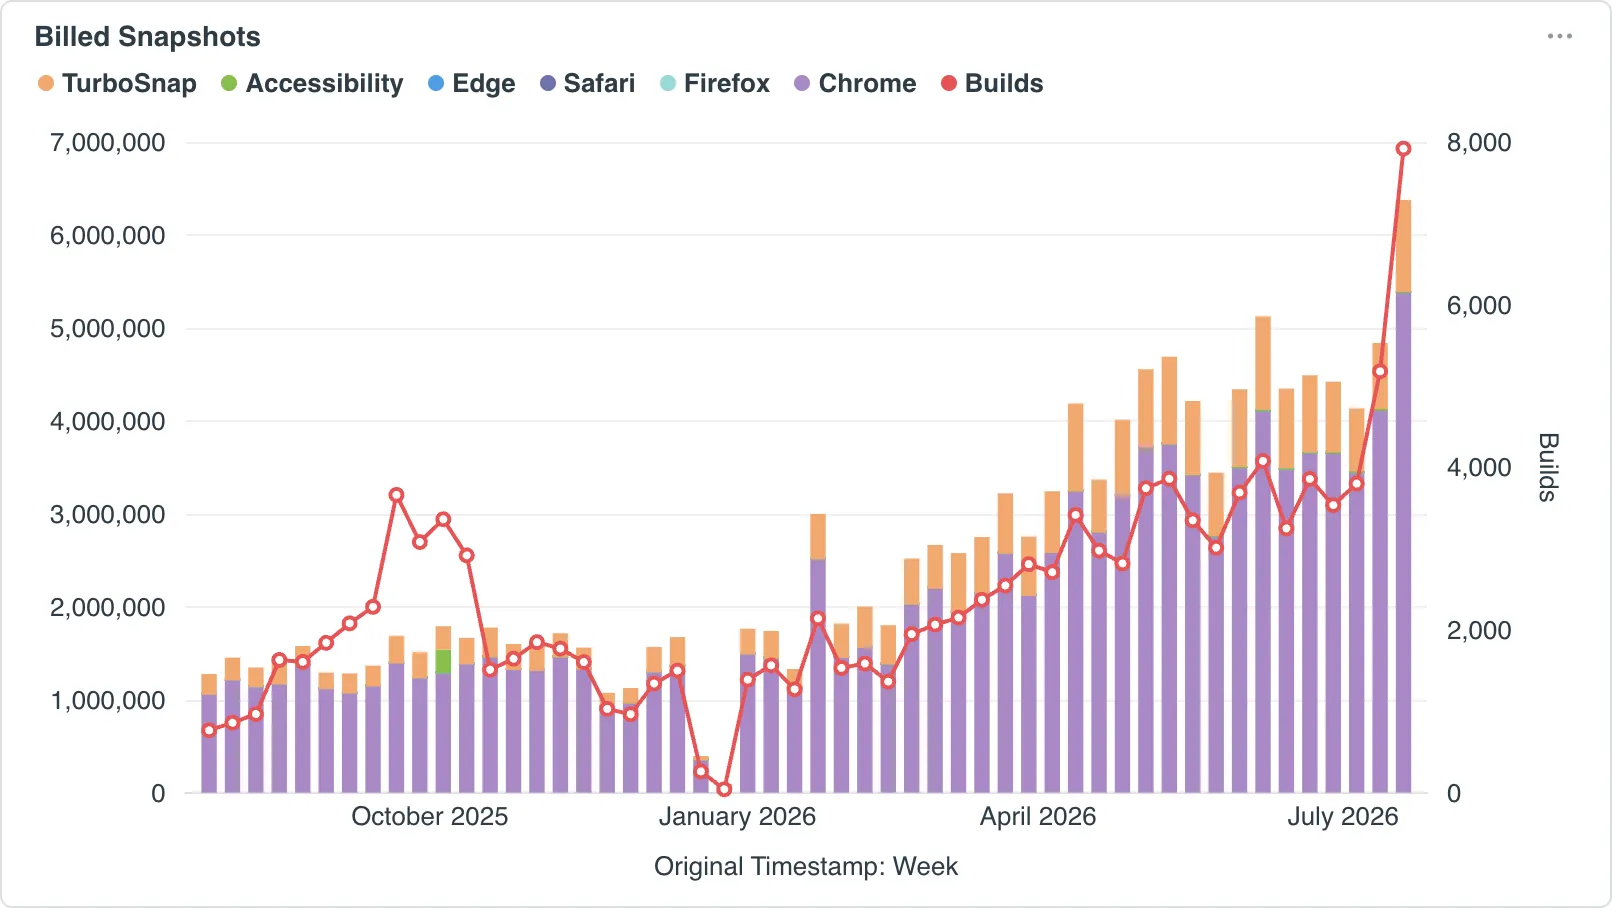
Check whether most of your usage comes from one project, or whether one project’s pattern matches your account’s overall. Either way, that’s the project to focus on.
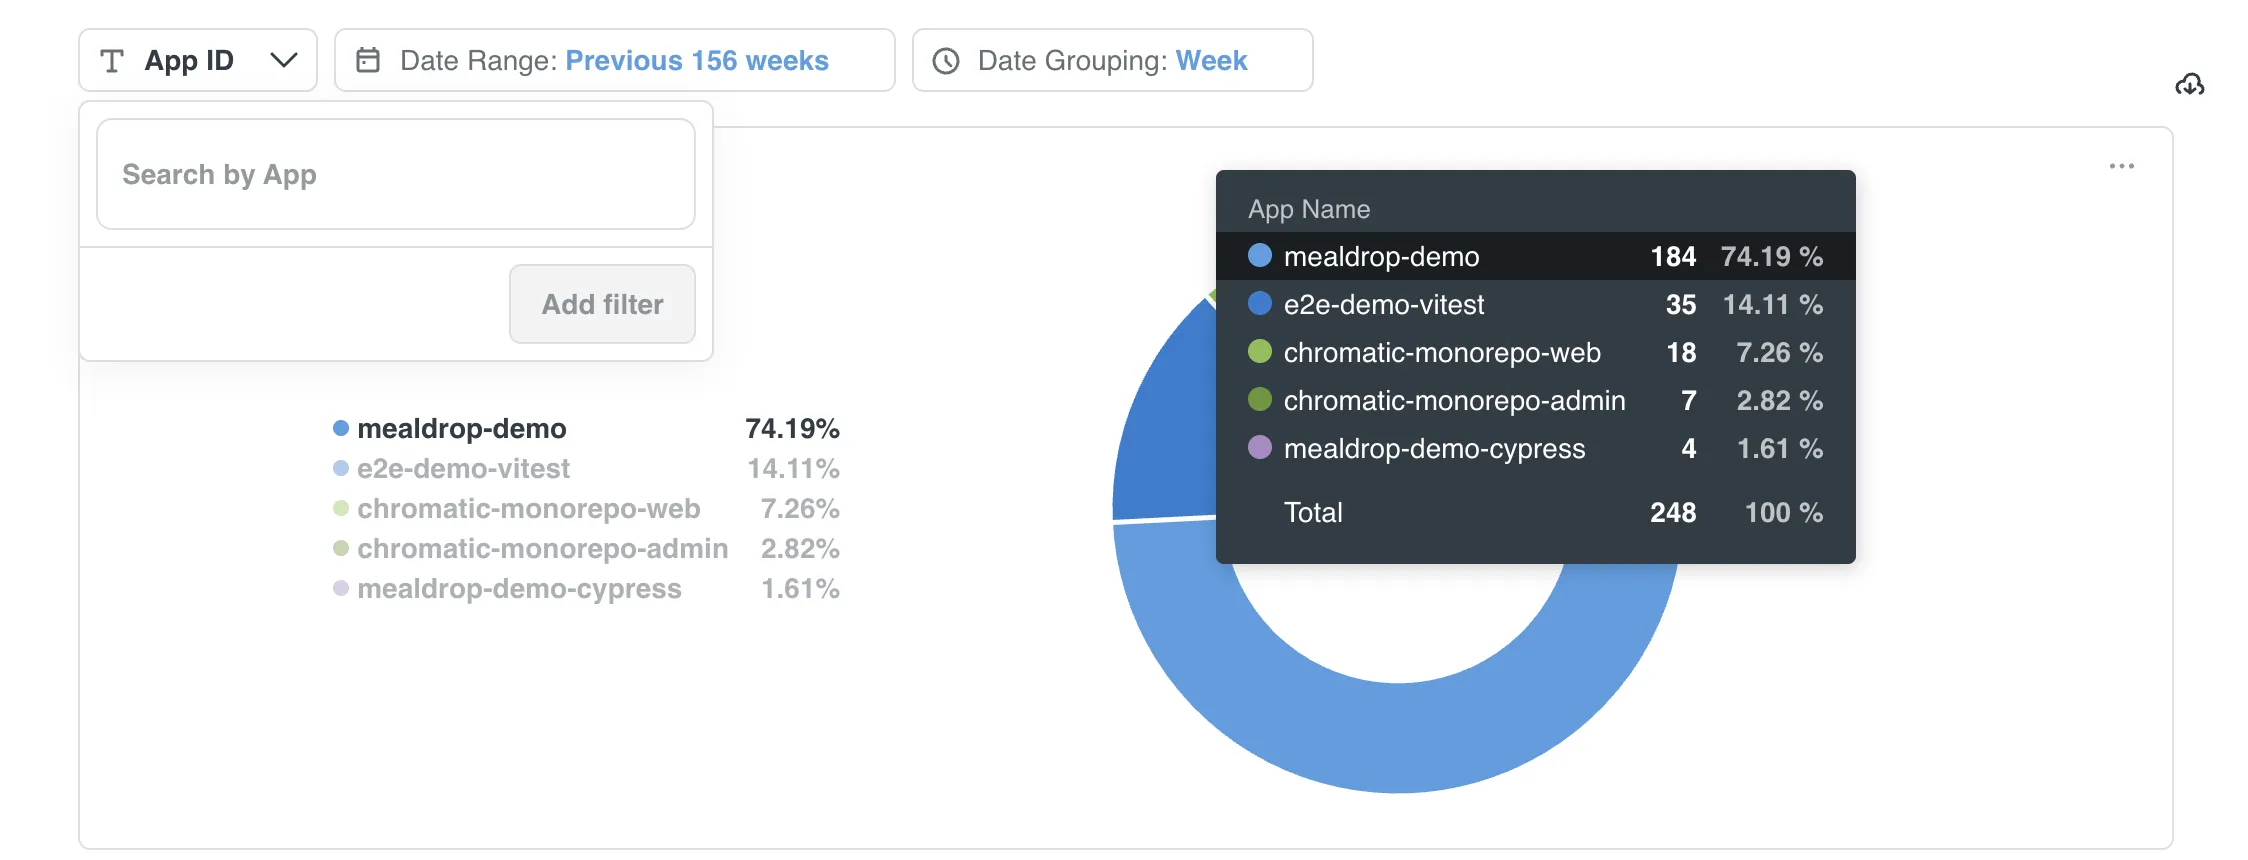
Filter the dashboard to it. Every other chart gets easier to read, and the cause of the change is easier to isolate.
To filter, click the project in the Billed Snapshots per Project donut chart, or select it from the App ID dropdown at the top left.
Did build count go up?
On the Billed Snapshots chart, compare the Builds line against the bars. Whether the two track each other tells you which driver to investigate next.
They line up: more builds is almost certainly the cause. Continue to “Are builds outpacing PRs?” to find out why build volume grew.
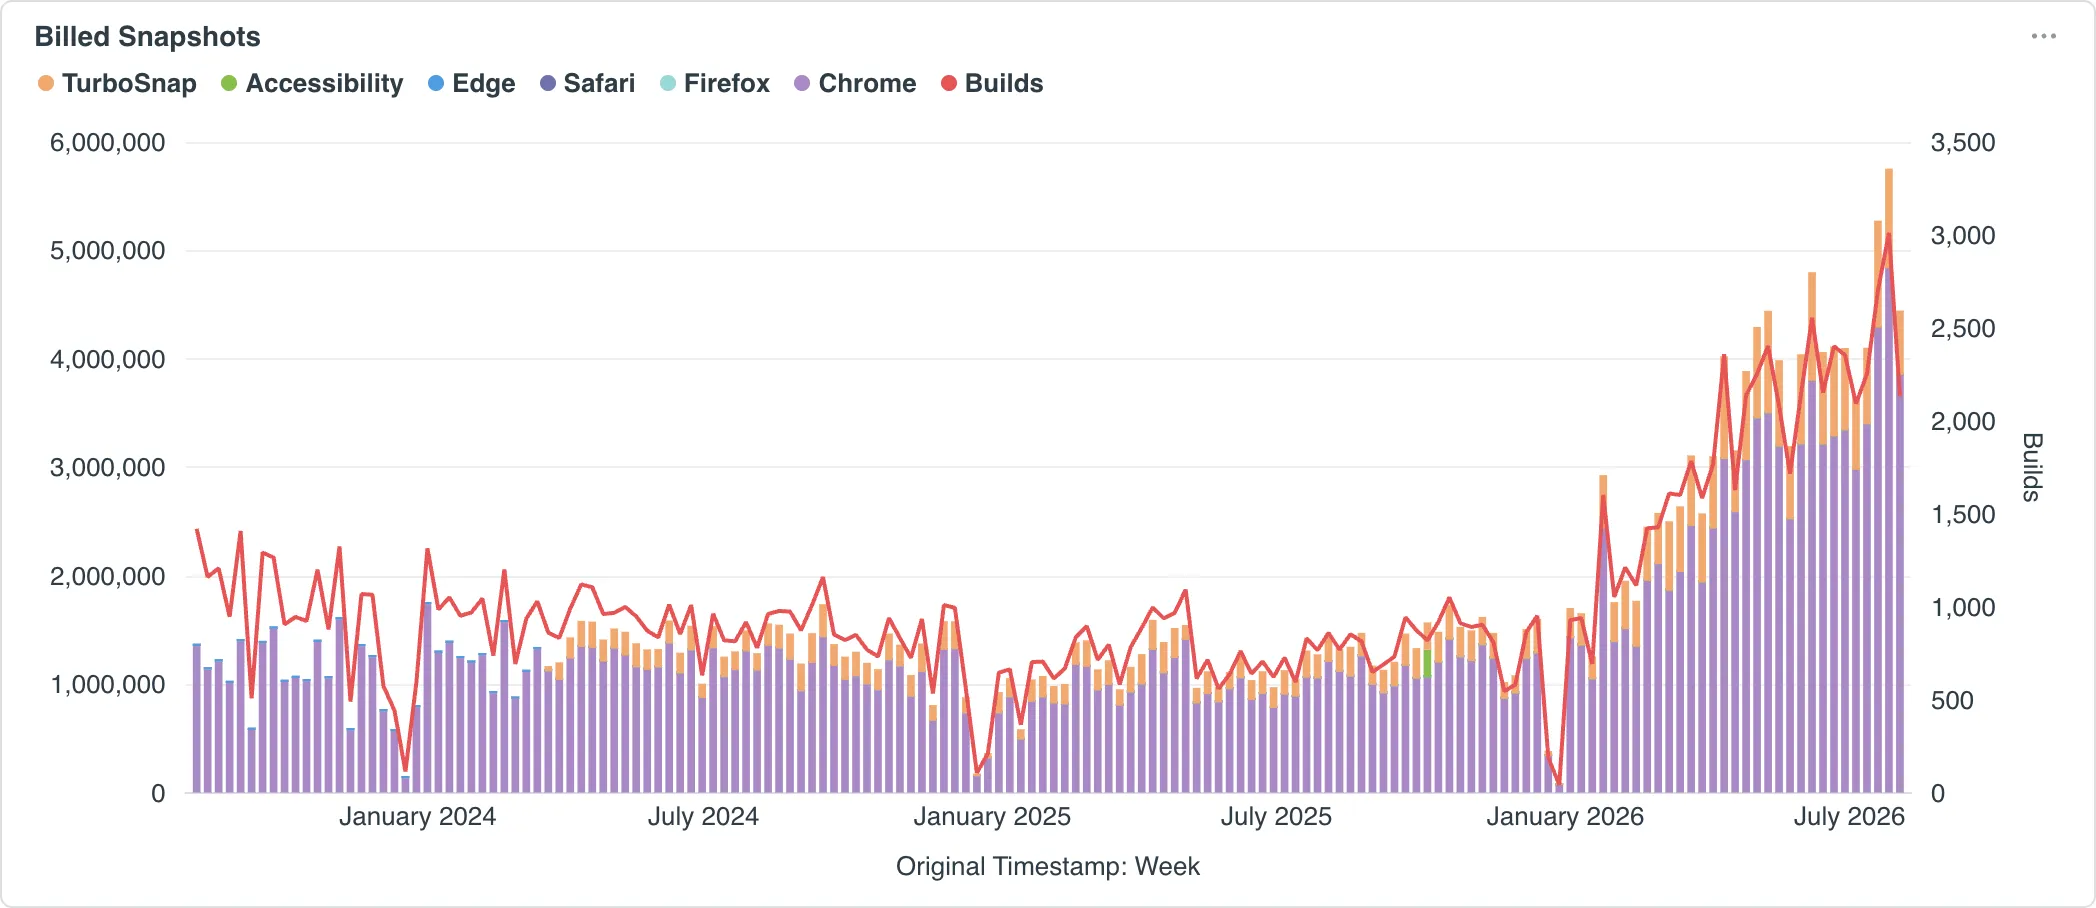
They don’t line up: snapshots per build is the bigger contributor. Skip ahead to “Are snapshots per build climbing?“.
Are builds outpacing PRs?
More PRs mean more builds, and more usage. Use the Build count chart to compare the two.
If builds track PRs, usage is growing with your team’s output. If builds outpace PRs, something structural is adding builds: more commits per PR than before, or builds running on a long-lived branch.
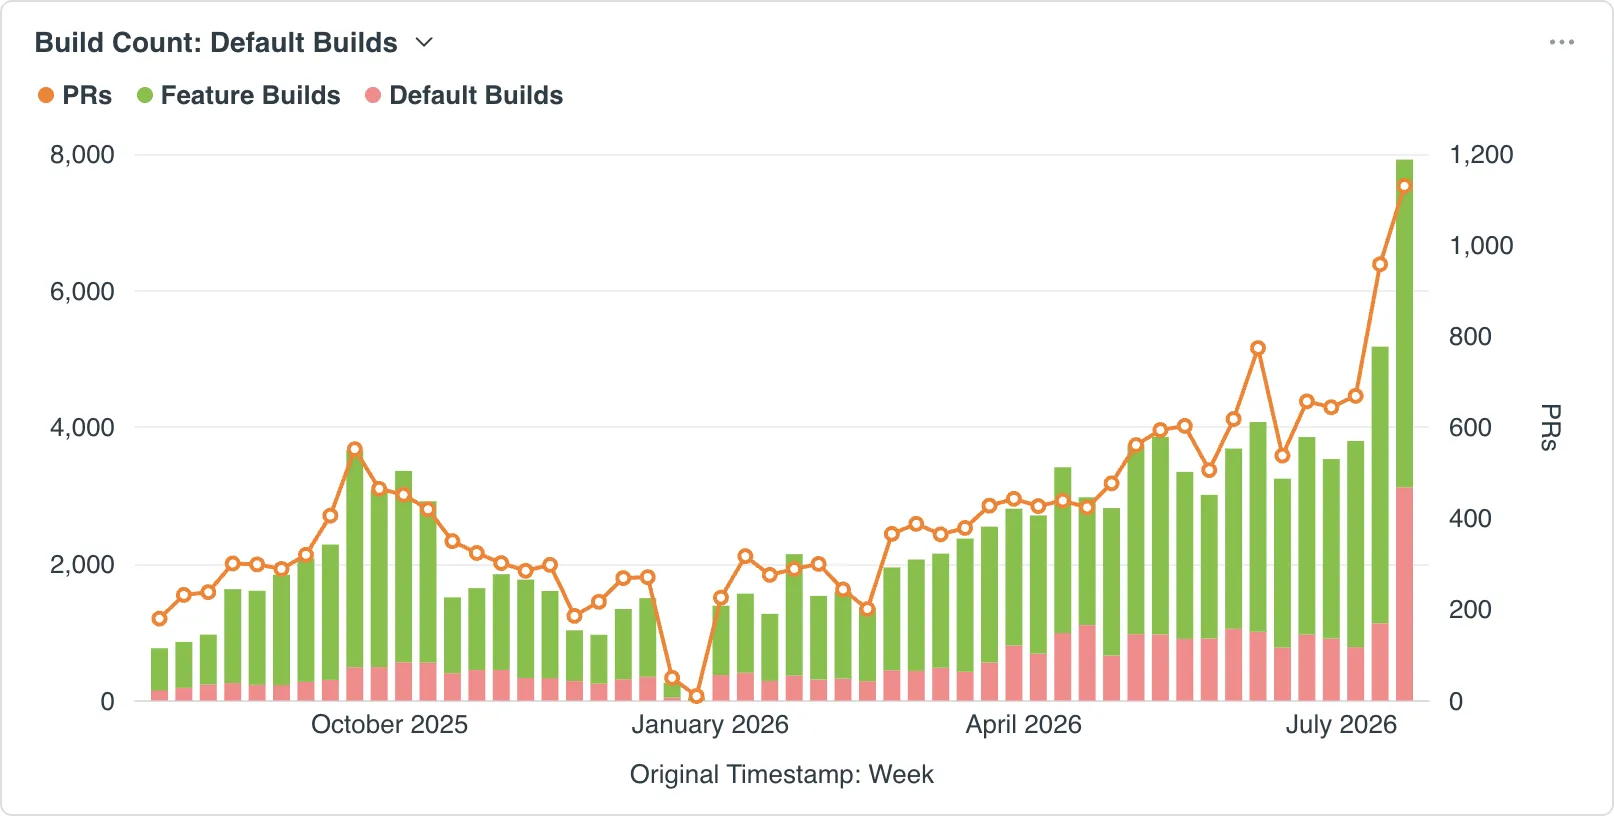
Default branches are those with a name commonly used for a trunk: main, master, trunk, dev, devel, development, staging, prod, or production.
The chart treats every build on a non-default branch as a PR, so its PR count may run slightly higher than your Git provider’s.
Are snapshots per build climbing?
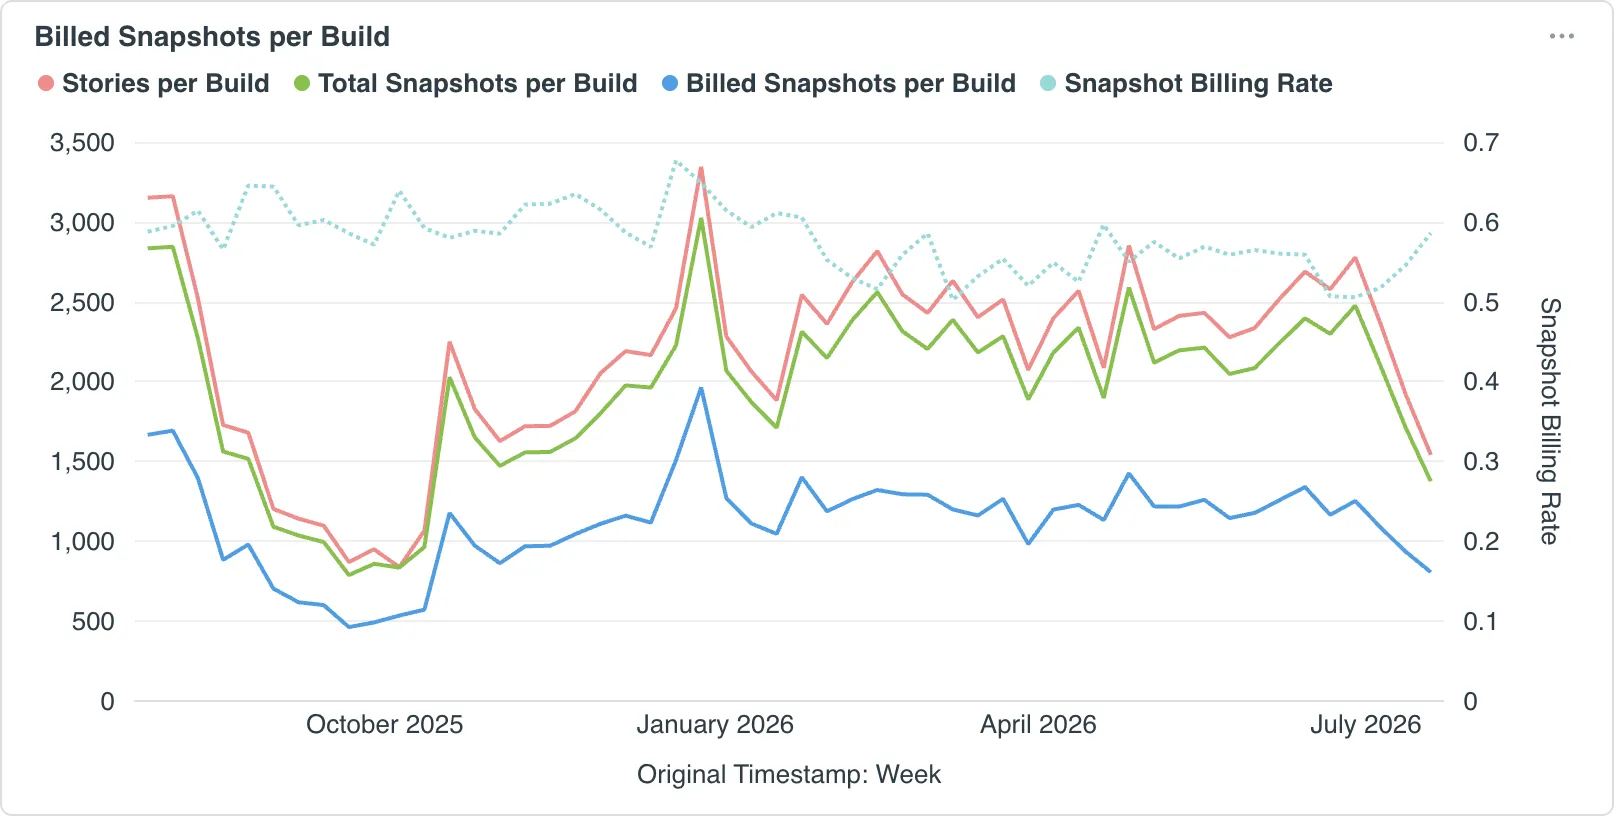
Total Snapshots per Build rises naturally as you add tests, so a gradual climb usually just reflects growing coverage.
A sharp jump points to a specific change: a new test type enabled (accessibility or visual), or more browsers added across the board. If neither happened, check your CI setup for a misconfiguration.
Is your billing rate coming down?
TurboSnap is meant to offset that growth. It copies or bypasses snapshots it can tell haven’t changed instead of capturing them again, and both cost less than a capture.
| Snapshot type | Cost (billed snapshot) |
|---|---|
| Captured | 1.0 |
| Copied | 0.2 |
| Bypassed | 0 |
Snapshot Billing Rate is the ratio of billed snapshots to total snapshots. The more captures TurboSnap replaces with copies and bypasses, the lower the rate.
A rate of 1.0 means every snapshot is captured, so TurboSnap either isn’t set up yet or is misconfigured. When it’s working, the rate sits below 1.0 and falls further as Total Snapshots per Build rises.
Is TurboSnap bailing too often?
Bails are the most common reason a billing rate won’t come down. A bailed build captures everything, so Billed Snapshots per Build climbs even when Total Snapshots per Build holds steady.
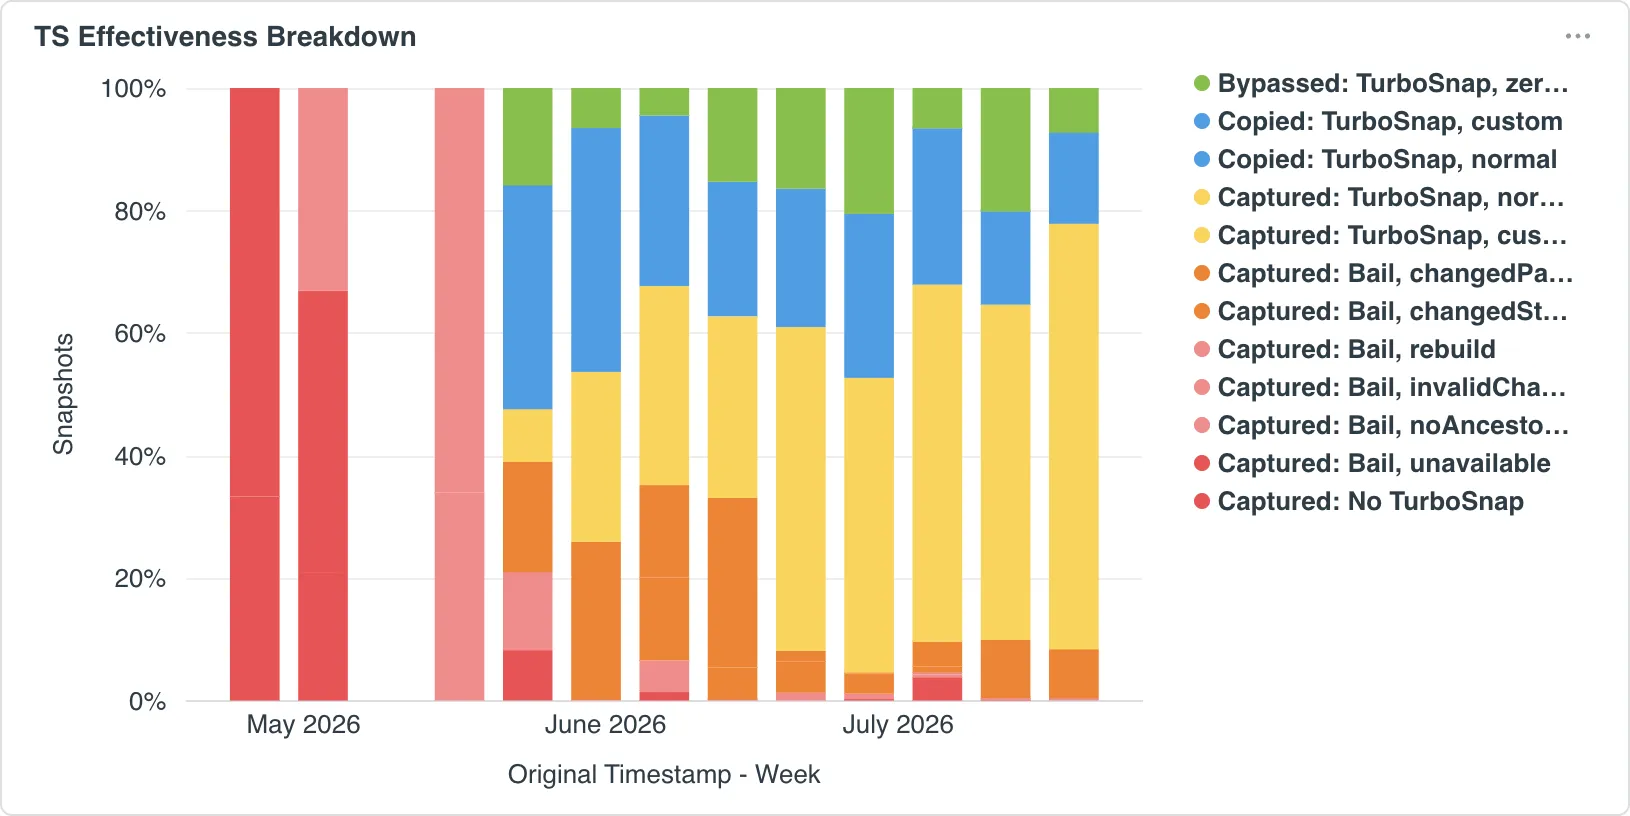
Use the TurboSnap effectiveness chart to see the mix. Your goal is to shrink the bail segments and grow the copied and bypassed ones.
Why TurboSnap bails affect your bill
TurboSnap copies a snapshot only when it can confidently determine that nothing affecting that test changed, based on your Git history and dependency graph.
It bails when it can’t establish that. How your CI checks out history, barrel files, and your Storybook configuration are common causes, among others.
On a bail, Chromatic captures every test at 1 billed snapshot each instead of copying the unchanged ones at 0.2.
Identifying the root cause of bails
The chart segments bails by reason, so you can see which one dominates. To find the specific builds behind it, export bail reasons per build from the usage report CSV.
If bails make up a significant share of your builds, work through TurboSnap troubleshooting to resolve them.